Graphs of Functions
Homework: Section 1.1 #66,70,95 and Section 1.2 #31-35 odd, 44-46, 85, 86, 89-94, 97, 111, 113
x=the directed distance from the y-axis (domain)
f(x)= the directed distance from the x-axis (range)
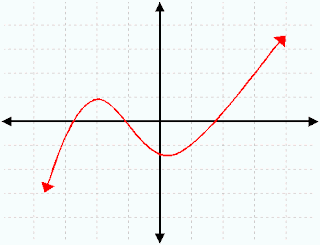
Today in class we went over how to read if a graphs function is increasing, decreasing, or staying constant. A function "f" is increasing on an interval if for any X1 and X2 in the interval X1 less than X2 implies F(X1) is less than F(X2).
Increasing, Decreasing, and Constant Functions:
Increasing- X1
Constant-f(X1)= f(X2)


The graph below increases on the left side and begins to decrease a bit as you go towards the right.

moving left to right


Increasing- X1 f(X2)
ReplyDeleteConstant- f(X1)= f(X2)
Although it might appear that there is an interval in which this function is constant, it is actually increasing throughout the entire line**
ReplyDelete