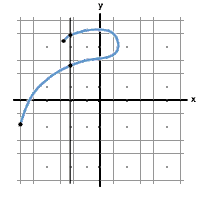
--> This is not a function. As you can see when you use the vertical line test it crosses the blue line twice therefore it is not a function.


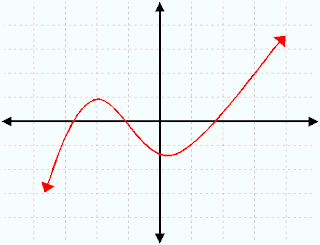
<---- This is a function. If you use the vertical line test and move the line vertically throughout the entire graph it only crosses each part of the red line once.
Today in class we were introduced to the chapter on functions. A function is a relation where every value in the domain is assigned one value in the range. Or as we have all heard before for every input there is only one possible output. The domain is the set of x values. This set of numbers is also referred to as the possible inputs or the independent variable. The range is the set of y values. This set of data is also referred to as the possible outputs or the dependent variable. If an equation is written as y=x^2 then it is a function. If an equation is written as y^2=x it is not a function. The variable y with any power= x are normally not functions and absolute values are also not normally functions. To see whether or not a graph is a function you must use the vertical line test. The vertical line should only pass through one line on the graph. If it passes through more than one then it is not a function. Our homework for the night is Section 1.1 #1-6, 18-24,26,31-33,37,43,46-56 even
Example:
Set of values that is a function: (-3,2) (-1,1) (0,0) (1,5) (2,8)
Set of values that is not a function: (-4,-2) (-4,4) (0,0) (2,4) (3,6)
No comments:
Post a Comment