The inverse of a function is defined as f^-1(x).
2 functions; F and G, are inverses iff (f(g(x)) = g(f(x))
In other words, when the input is the output, where there is no net change.
To find the inverse of a function:
Example:
f(x) = 2x+5
f^-1(x) = ?
You would perform the following:
the original function is:
f(x) = 2x+5
and since f(x) is equal to y...
y= 2x+5
then you switch x and y...
x= 2y+5
and then you solve for y...
x-5 = 2y +5 -5
x-5= 2y
(x-5) /2 = 2y /2
y= (x-5) /2
and so:
f^-1(x) = (x-5) /2
to validate, you would show that f(f^-1(x)) = f^-1(f(x))
so;
f(f^-1(x)) = f((x-5) /2)
= ((2x+5)-5) /2
= 2x /2
= x
f^-1(f(x)) = f^-1(2x+5)
= 2((x-5) /2) +5
= x
so the inverse is correct because both equations come out to x
One-to-one means that for every y value, there is only one x value
a function f is one to one iff f(a) = f(b) implies a=b
ex:
f(x) = 2x+5
f(a) =2a+5 f(b) =2b+5
-5 -5
f(a) =2a f(b)= 2b
/2 /2
a=2=b
a=b
so the function is one to one
one-to-one functions must pass the horizontal line test, which must be true to have an inverse that is a real function.
Thursday, September 30, 2010
Tuesday, September 28, 2010
Compositions of Functions
Today we learned about composition of functions.
Another way of combining two functions is to form the composition of one with the other. For example, if f(x) = x^2 and g(x) = x + 1, the composition of f with g is:
f ( g( x ) ) = f ( x + 1 ) = ( x + 1 )^2
The composition of the function f with g is:
( f o g ) ( x ) = f ( g ( x ) )
The domain of f o g is the set of all x in the domain of g such that g(x) is in the domain of f.
EXAMPLE:
f(x) = 2x+4 and g(x) = x^2 - 7
(f o g) (x) = f (g(x))
= 2(x^2 - 7) + 4
= 2x^2 - 14 + 4
= 2x^2 - 10
Section 1-3 Shifting, Reflecting, and Stretching Graphs
Sunday, September 26, 2010
By: James Thomas
To understand how graphs can shift and reflect you must first know about the parent functions of the graph.
Parent Function: The most basic form of a equation for a graph.
Vertical and Horizontal Shifts
1) Vertical shift c units upward h(x)=f(x)+c
2) Vertical shift c units downward h(x)=f(x)-c
3) Horizontal shift c units to the right h(x)=f(x+c)
4) Horizontal shift c units to the right h(x)=f(x-c)
Example:
- g(x)=(x-2)2+3
Parent function = g(x)=x2
Horizontal Shift = -2....... Right Three (Translate the opposite of the sign)
Vertical Shift = +3...... Up Three

Reflecting Graphs
Graphs can also be reflected over the x-axis and y-axis depending on a (-) sign in the equation.
- Reflection over the x-axis h(x)=-f(x)
- Reflection over the y-axis h(x)=f(-x)
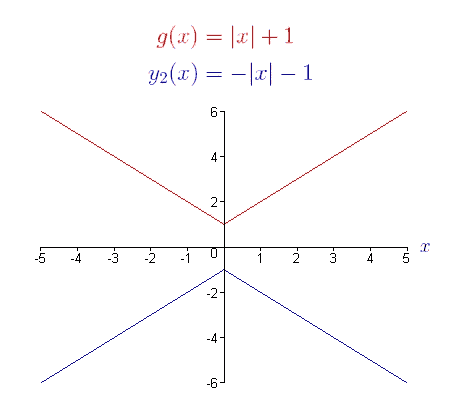
Example:

Nonrigid Transformations:
- Rigid Transformations- Horizontal and Vertical Shifts because they dont affect the graphs shape or structure, just the location.
- Nonrigid Transformations - Causes a distortion in the graph making it skinnier or fatter.
y=cf(x)
- Skinny Transformation = 0 < c < 1
- Fatter Transformation = c > 1
Example:
- g(x) = 3x2 , g(x)= 1/4x2

Monday, September 27, 2010
Arithmetic Combinations
Today we reviewed Arithmetic Combinations.
They are as follows:
(let f(x) = 3x + 2 and g(x) = x^2 - 5x)
addition - (f+g)(x) = f(x) + g(x)
ex. (f+g)(x) = 3x + 2 + x^2 - 5x
(f+g)(x) = x^2 - 3x + 2
subtraction - (f-g)(x) = f(x) - g(x)
make sure to distribute the minus sign throughout the the function g(x)
ex. (f-g)(x) = (3x + 2) - (x^2 - 5x)
(f-g)(x) = 3x + 2 - x^2 + 5x
(f-g)(x) = -x^2 + 8x + 2
multiplication - (fg)(x) = (f(x)) (g(x))
ex. (fg)(x) = (3x + 2)(x^2 - 5x)
(fg)(x) = 3x^3 - 15x^2 + 2x^2 - 10x
(fg)(x) = 3x^3 - 13x^2 - 10x
division - (f/g)(x) = (f(x)) / (g(x))
watch out for extraneous solutions that might not have been extraneous when the
two functions were seperate
ex. (f/g)(x) = (3x + 2)
(x^2 - 5x)
x cannot equal 5
graphing arithmetic combinations
I'm sorry there are no graphs. For some reason I was unable to upload images. If anyone else can figure out a way to add some example graphs in a comment please do.
for addition and subtraction, add and subtract the y-coordinates
for multiplication and division, multiply and divide the y-coordinates
Monday, September 20, 2010
Chapter 1 Section 2
Even and Odd Functions
By: Scott Simon

Since the opposite of x makes this function the same as it was with x, it is an even function.
Homework: section 1.2 #'s 47-49,51, 61-71 odd
Today in class we learned that functions can be even, odd, or neither even or odd.
A function is an even function when you plug in the opposite of x (which is negative x) for x and the function remains as it originally was.
Example:

Since the opposite of x makes this function the same as it was with x, it is an even function.
If the opposite of x in a function makes it the opposite of the original function, then it is an odd function.
Example:
This looks like the opposite, but you have to check by solving for the opposite of the function, which means multiplying the whole function by -1. If it is not actually the opposite, then it is neither even nor odd.
Sunday, September 19, 2010
Chapter 1 Section 2
Graphs of Functions
Homework: Section 1.1 #66,70,95 and Section 1.2 #31-35 odd, 44-46, 85, 86, 89-94, 97, 111, 113
x=the directed distance from the y-axis (domain)
f(x)= the directed distance from the x-axis (range)
Today in class we went over how to read if a graphs function is increasing, decreasing, or staying constant. A function "f" is increasing on an interval if for any X1 and X2 in the interval X1 less than X2 implies F(X1) is less than F(X2).
Increasing, Decreasing, and Constant Functions:
Increasing- X1< implies=""> f(X2).
Constant-f(X1)= f(X2)


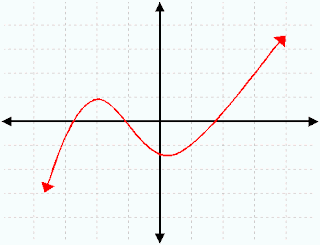
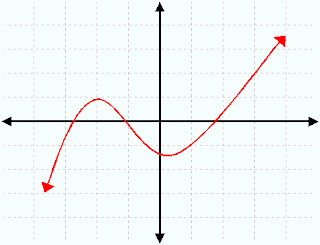
The graph below increases on the left side and begins to decrease a bit as you go towards the right.

moving left to right
Graphs of Functions
Homework: Section 1.1 #66,70,95 and Section 1.2 #31-35 odd, 44-46, 85, 86, 89-94, 97, 111, 113
x=the directed distance from the y-axis (domain)
f(x)= the directed distance from the x-axis (range)
Today in class we went over how to read if a graphs function is increasing, decreasing, or staying constant. A function "f" is increasing on an interval if for any X1 and X2 in the interval X1 less than X2 implies F(X1) is less than F(X2).
Increasing, Decreasing, and Constant Functions:
Increasing- X1
Constant-f(X1)= f(X2)


The graph below increases on the left side and begins to decrease a bit as you go towards the right.

moving left to right
Wednesday, September 15, 2010
Chapter 1 Section 1
Functions 9/15/2010 By: Emily Smith
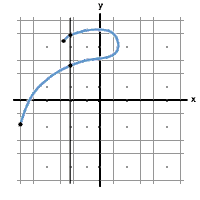
--> This is not a function. As you can see when you use the vertical line test it crosses the blue line twice therefore it is not a function.

--> This is not a function. As you can see when you use the vertical line test it crosses the blue line twice therefore it is not a function.


<---- This is a function. If you use the vertical line test and move the line vertically throughout the entire graph it only crosses each part of the red line once.
Today in class we were introduced to the chapter on functions. A function is a relation where every value in the domain is assigned one value in the range. Or as we have all heard before for every input there is only one possible output. The domain is the set of x values. This set of numbers is also referred to as the possible inputs or the independent variable. The range is the set of y values. This set of data is also referred to as the possible outputs or the dependent variable. If an equation is written as y=x^2 then it is a function. If an equation is written as y^2=x it is not a function. The variable y with any power= x are normally not functions and absolute values are also not normally functions. To see whether or not a graph is a function you must use the vertical line test. The vertical line should only pass through one line on the graph. If it passes through more than one then it is not a function. Our homework for the night is Section 1.1 #1-6, 18-24,26,31-33,37,43,46-56 even
Example:
Set of values that is a function: (-3,2) (-1,1) (0,0) (1,5) (2,8)
Set of values that is not a function: (-4,-2) (-4,4) (0,0) (2,4) (3,6)
Friday, September 10, 2010
Chapter P
Sections P.4 and P.5 were review of topics, mostly from Algebra 2, with which you should be familiar. Section P.4 focused on solving equations of many types. The ones we spent the most time with were equations involving fractions and radical expressions.
Perhaps the easiest way to solve an equation with rational expressions (i.e., fractions) is to multiply both sides of the equation by the least common multiple of all the denominators. Multiplying through will eliminate all the denominators, so there will be no fractions remaining. From there, the equation will usually be either quadratic or linear and should be relatively straightforward to solve. Remember to check that none of your solutions make any denominator in the original equation equal zero.
When a variable is under a radical, both sides of the equation will need to be squared. Before doing this, isolate the radical term. (When there are two radical terms, it is typically easier to separate them before squaring both sides for the first time.) After squaring both sides of the equation, you will usually be left with a quadratic or linear equation to solve. Remember to check for extraneous solutions! When you square both sides of an equation, you open the door to extraneous solutions, so you have to check them by plugging them into the original equation.
P.5 dealt primarily with absolute value and inequalities.
Definition of absolute value:
|x| = a if and only if x = a or - x = a
for inequalitites:
|x| < a if and only if x < a or - x < a
Example:
Once the absolute value expression is isolated on one side of the inequality sign, split the problem into two separate inequalities (based on the definition above).

Polynomial inequalities are a big part of P.5. Solving them is more complicated than solving equations.
Before the official solving begins, you must have a zero on one side of the inequality.
The first to solve a polynomial inequality is to find the zeros of the polynomial.
Use these zero to set up intervals, and then pick a test value in each interval.
Plug each test value into the polynomial and see if its value is positive or negative.
Your solution will include all the intervals that matched your inequality (+ for >0 and - for <0).
This process makes more sense when you consider the graph of your inequality. The inequality is >0 when its graph is above the x-axis and <0 when its graph is below the x-axis. Setting up the test intervals is a numeric way of making that determination.
Example:
The first order of business is to find the zeros of the polynomial.
Perhaps the easiest way to solve an equation with rational expressions (i.e., fractions) is to multiply both sides of the equation by the least common multiple of all the denominators. Multiplying through will eliminate all the denominators, so there will be no fractions remaining. From there, the equation will usually be either quadratic or linear and should be relatively straightforward to solve. Remember to check that none of your solutions make any denominator in the original equation equal zero.
When a variable is under a radical, both sides of the equation will need to be squared. Before doing this, isolate the radical term. (When there are two radical terms, it is typically easier to separate them before squaring both sides for the first time.) After squaring both sides of the equation, you will usually be left with a quadratic or linear equation to solve. Remember to check for extraneous solutions! When you square both sides of an equation, you open the door to extraneous solutions, so you have to check them by plugging them into the original equation.
P.5 dealt primarily with absolute value and inequalities.
Definition of absolute value:
|x| = a if and only if x = a or - x = a
for inequalitites:
|x| < a if and only if x < a or - x < a
Example:

Using interval notation, we would represent our solution as [2,3].
Polynomial inequalities are a big part of P.5. Solving them is more complicated than solving equations.
Before the official solving begins, you must have a zero on one side of the inequality.
The first to solve a polynomial inequality is to find the zeros of the polynomial.
Use these zero to set up intervals, and then pick a test value in each interval.
Plug each test value into the polynomial and see if its value is positive or negative.
Your solution will include all the intervals that matched your inequality (+ for >0 and - for <0).
This process makes more sense when you consider the graph of your inequality. The inequality is >0 when its graph is above the x-axis and <0 when its graph is below the x-axis. Setting up the test intervals is a numeric way of making that determination.
Example:
The first order of business is to find the zeros of the polynomial.
Next, plot the zeros on a number line to establish the test intervals, then choose a test value from each interval. Plug that value into the polynomial and determine if the polynomial's value is postive or negative.
We were interested in where the polynomial was <0, so we choose the interval where f (x) was negative.
Using interval notation, we would express our solution as (3,5).
Below is the graph of the polynomial. Looking at that, it is clear that the interval where the graph is below the x-axis (<0) is from 3 to 5.
Labels:
absolute value,
Chapter P,
polynomial inequalities
Thursday, September 2, 2010
Welcome
Hello everybody. Welcome to our class's blog. This is where you all will be posting your take on what we're learning in class and keep the conversation going.
Please create a Blogger account and email me <tw04bps@birmingham.k12.mi.us> your username, so I can keep track of and give you credit for your contributions.
Please create a Blogger account and email me <tw04bps@birmingham.k12.mi.us> your username, so I can keep track of and give you credit for your contributions.
Subscribe to:
Comments (Atom)


